The question is - is the error being amplified or is the accuracy being amplified?
in high variance systems, it appears, that the model ends up emulating different sections of the data set. From the point of veiw of the statistical measures of accuracy, models with very different ____ qualities, may appear equivalent.
Since this situation would always be reflected in higher error in atleast one of the three error values, we at least know when the model is definitely incomplete. an objective measure of completeness is not easily found because we do not have information other than the training data (which is called - lack of meta data) to compare it with. an issue resulting from dealing with a largly unknown system.
Regarding Sensitivity Analysis
if similarities are found between complete models and incomplete models -
can it be concluded -
that the similarities are strongly persistent in the entire set.
(data and random nos. should not give the same kinds of results - ... does this need any more work to be done.
eventually, the results of sensitivity analysis is dependent on
- the raw data,
- the neural network model
Thursday, November 30, 2006
Wednesday, November 29, 2006
Comparing models
The difference between the converged networks (or models where values for free parameters have been determined) may be more for certain datasets (DS4); and less for others (DS1).
what i mean is,
for DS1 - after repeating the process a reasonable no. of times, the network tends to reach some kind of a minima region where networks are very similar - this region seems to have close approximations of the actual relationship.
on other hand for DS4 - say, two networks converge and give very similar regression coefficient values (and sometimes even similar mse and mape values) but there is a huge difference between these networks. what is interesting is that they give very similar sensitivity analysis results.
Updates:
for example of what i am saying
- see ds4fss2days3hrsHL7_no2 and ds4fss2days3hrsHL7_no3
what, i guess, i am questioning is how well do 3 values describe the quality of the model. do they do it well - because that would mean that two models that visually look very different from each other will be the same quality. and how is it affected by consistent results from SA or the lack of consistency in results from SA.
Tuesday, November 28, 2006
Monday, November 27, 2006
statistics basics 2
having visited covariance and correlation here; let us continue with some more basic definitions. i am picking these up using google 'define: ' facility. unless it is something earth breakingly original, i would not cite reference.
Multivariate Analysis of Variance
And from manova page here
Analysis of Variance: Statistical test of significance developed by Sir Ronald fisher. It is also called the F-Ratio or ANOVA for ANalysis Of Variance. The test is designed to establish whether or not a significant (nonchance/nonrandom) difference exists among several sample means. Statistically, it is the ratio of the variance occurring between the sample means to the variance occurring within the sample groups.and from Wikipedia
A large F-Ratio, that is when the variance between is larger than the variance within, usually indicates a nonchance/nonrandom significant difference -- that is a difference created by the introduction of the independent variable.
Analysis of variance (ANOVA) is a collection of statistical models and their associated procedures which compare means by splitting the overall observed variance into different parts.
The initial techniques of the analysis of variance were pioneered by the statistician and geneticist R. A. Fisher in the 1920s and 1930s, and is sometimes known as Fisher's ANOVA or Fisher's analysis of variance, due to the use of Fisher's F-distribution as part of the test of statistical significance.
One-way ANOVA is used to test for differences among three or more independent groups.
Multivariate analysis of variance (MANOVA) is used when there is more than one dependent variable.
Multivariate Analysis of Variance
Multivariate analysis of variance (MANOVA) is an extension of analysis of variance (ANOVA) methods to cover cases where there is more than one dependent variable and where the dependent variables cannot simply be combined.
As well as
* identifying whether changes in the independent variables have a significant effect on the dependent variables,
* the technique also seeks to identify the interactions among the independent variables and the association between dependent variables, if any.
And from manova page here
The main objective in using MANOVA is to determine if the response variables, are altered by the observer’s manipulation of the independent variables. Therefore, there are several types of research questions that may be answered by using MANOVA:
1) What are the main effects of the independent variables?
2) What are the interactions among the independent variables?
3) What is the importance of the dependent variables?
4) What is the strength of association between dependent variables?
5) What are the effects of covariates? How may they be utilized?
Assumptions
Normal Distribution: - The dependent variable should be normally distributed within groups. Overall, the F test is robust to non-normality, if the non-normality is caused by skewness rather than by outliers. Tests for outliers should be run before performing a MANOVA, and outliers should be transformed or removed.
Linearity: - MANOVA assumes that there are linear relationships among all pairs of dependent variables, all pairs of covariates, and all dependent variable-covariate pairs in each cell. Therefore, when the relationship deviates from linearity, the power of the analysis will be compromised.
Homogeneity of Variances: - Homogeneity of variances assumes that the dependent variables exhibit equal levels of variance across the range of predictor variables. Remember that the error variance is computed (SS error) by adding up the sums of squares within each group. If the variances in the two groups are different from each other, then adding the two together is not appropriate, and will not yield an estimate of the common within-group variance. Homoscedasticity can be examined graphically or by means of a number of statistical tests.
Homogeneity of Variances and Covariances: - In multivariate designs, with multiple dependent measures, the homogeneity of variances assumption described earlier also applies. However, since there are multiple dependent variables, it is also required that their intercorrelations (covariances) are homogeneous across the cells of the design. There are various specific tests of this assumption.

excellent time series modeling text

http://statistik.mathematik.uni-wuerzburg.de/timeseries/index.php?id=book or here
An excellent excellent text - starting from the basics. should be printed out, yellowed out and well used.
It speaks clearly and not down to you. A lot of mathematical proofs (which add up jargon so quickly) are included - but if you are not inhibited by greek alphabets, they make sense. Another advantage is it relative to other stat texts, not very large (222 pages of actual book).
the only thing that the authors could have skipped is the cover page - positively unaesthetic ;D
oh and i did mention it is FREE!
Looking for periodicity in a time series
"Spectral analysis was conducted to test for seasonality, detecting periodicity in time series, by plotting spectral density against period."apparently this is more often called - spectrogram or periodogram.
Information about cycles that are inherent in given data can also be deduced from the empirical autocorrelation function.
(under heading autocorrelation function and periodograms)
from First Course in Time Series Analysis
The above book has an SAS algorithm to compute periodogram, however I have yet to figure out how to do it either in MATLAB or Minitab.
A plot of amplitude or squared amplitude against frequency for the wave components of a periodic function represented by a Fourier series.
The periodogram is evaluated in practice from a finite digital sequence using the fast Fourier transform. The raw periodogram is not a good spectral estimate since it suffers from spectral bias and variance problems.
from wikipedia
Basic Statistics - defintions
The covariance of two variables is the average of first variable minus its means times second variable minus its mean
 this measures how the variables vary together.
Correlation between two variables is the covariance of the two variables divided by product of standard deviations of the two variables. This standardizes the correlation to lie between -1 to +1
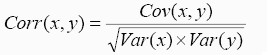 Correlation measures the strength of the linear relationship between two variables.
pg. 46
Bayesian statistics
William m. blostad
wiley
 this measures how the variables vary together.
 Correlation between two variables is the covariance of the two variables divided by product of standard deviations of the two variables. This standardizes the correlation to lie between -1 to +1
 Correlation measures the strength of the linear relationship between two variables.
 pg. 46
Bayesian statistics
William m. blostad
wiley
dreams
have you ever felt that there is a dream just beyond your reach. that if your finger tips could just pinch at the fair cloth and then pull it to make your own - it would be yours forever. felt like your head is borosil bowl in which the ---- is just about to crystalise. and when that happens the entire scenario will change and there would be a rock to clasp in your hand, and feel its rugged surface gently in your palm. that your mind like iron pieces is scattered and there is a magnet just beyond that threshold and would it tip but slightly here...
i find population biology like that. an understanding that is just beyond me, that would that magnet tip but a little this science would be mine like the crystal in my hand. fair and clear. a dream waiting to declare that it is mine; and as the crystal leaves all that is impure in the liquid behind, purest of all - my dream.
i find population biology like that. an understanding that is just beyond me, that would that magnet tip but a little this science would be mine like the crystal in my hand. fair and clear. a dream waiting to declare that it is mine; and as the crystal leaves all that is impure in the liquid behind, purest of all - my dream.
Friday, November 24, 2006
Physical - Biological Interactions Influencing Marine Plankton Production
Physical - Biological Interactions Influencing Marine Plankton Production
Kendra L. Daly, Walker O. Smith, Jr.
Annual Review of Ecology and Systematics, Vol. 24 (1993) pp 555-585
An excellent review article.
Daly and Smith(1993) review biological and physical interactions in oceans to see how they influence plantonik growth (mostly phytoplankton, but zooplanktons are also discussed) . As the paper talks only about marine environment the discussion is difficult to apply to a much smaller estuarine system; the currents in the oceans and the light gradient due to a much much greater depth are not applicable. also the freshwater influence, which will be significant for esturies, is not accounted for.
The similarity however is that they are both fluid and the organisms of interests are the same. Some questions are applicable to both ecological systems. It is also interesting to see how coastal estuarine systems interacts with the larger scale marine environment, from the latter's perspective. the discussion of estuarine systems is too peripheral and too generic to be of much direct use.
The paper is well organised; it is divided into 2 sections-
a) Physical interactions
which talk about physical processes like motion and light etc.
large scale - 1,000 to >10,000 km & years to centuries
mesoscale - 100 m to 100 km & days to months
smallscale - mm to meters & seconds to hours
b) Biological interactions
which talk about interactions between biological entities and between biological entities and their physical environment. these are further classified into large scale; mesoscale and small scale - (i found this classification system fuzzier).
large scale interactions
e.g. large scale heat absorbtion at a global level that impacts global temperature.
mesoscale interactions
at this scale plankton appear to temprarily adapt
??
small scale interactions
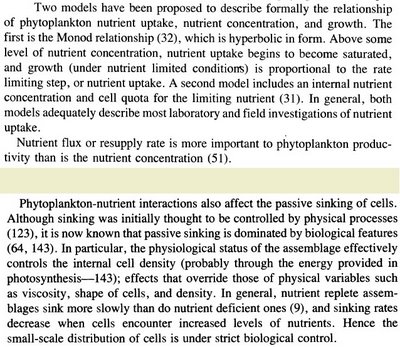
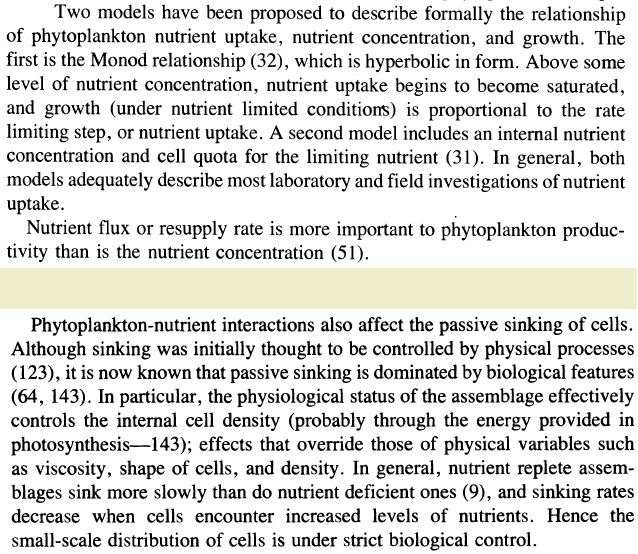
phytoplankton - nutrient interactions.
interactions with environment due to physiological response in the cells.
The paper, then, presents two case studies to discuss complexity of interactions. these are marine examples and did not interest me considerably.
interesting quotes from the paper are classified under following headings -
Kendra L. Daly, Walker O. Smith, Jr.
Annual Review of Ecology and Systematics, Vol. 24 (1993) pp 555-585
An excellent review article.
Daly and Smith(1993) review biological and physical interactions in oceans to see how they influence plantonik growth (mostly phytoplankton, but zooplanktons are also discussed) . As the paper talks only about marine environment the discussion is difficult to apply to a much smaller estuarine system; the currents in the oceans and the light gradient due to a much much greater depth are not applicable. also the freshwater influence, which will be significant for esturies, is not accounted for.
The similarity however is that they are both fluid and the organisms of interests are the same. Some questions are applicable to both ecological systems. It is also interesting to see how coastal estuarine systems interacts with the larger scale marine environment, from the latter's perspective. the discussion of estuarine systems is too peripheral and too generic to be of much direct use.
The paper is well organised; it is divided into 2 sections-
a) Physical interactions
which talk about physical processes like motion and light etc.
large scale - 1,000 to >10,000 km & years to centuries
mesoscale - 100 m to 100 km & days to months
smallscale - mm to meters & seconds to hours
b) Biological interactions
which talk about interactions between biological entities and between biological entities and their physical environment. these are further classified into large scale; mesoscale and small scale - (i found this classification system fuzzier).
large scale interactions
e.g. large scale heat absorbtion at a global level that impacts global temperature.
mesoscale interactions
at this scale plankton appear to temprarily adapt
??
small scale interactions
phytoplankton - nutrient interactions.
interactions with environment due to physiological response in the cells.
The paper, then, presents two case studies to discuss complexity of interactions. these are marine examples and did not interest me considerably.
interesting quotes from the paper are classified under following headings -
1. Scales of Interaction
2. Aquatic ecosystem
3. Physical indicators and their influence
4. Primary Production
Scales of Interaction
Quotes from Daly and Smith, 1993
1.
1.

2. The scale of a varying property is defined as the distance (or time) over which its quantity remains the same before significantly changing. The physical processes most likely to influence biological activity in the ocean are those that occur in the space/time domain intrinsic to specific organisms.
For example, the doubling time of phytoplankton ranges from about 0.5 to 10 days, in which time an individual cell may be transported several kilometers by currents. Thus, small- to meso-scale physical processes are relevant to the study of phytoplankton.
3. This review indicates that biological processes may be more important at smaller scales where behavior such as vertical migration and predation may control the location and production of plankton. Physical processes may be more important at larger scales in structuring biological communities and determining particle flow, but the magnitude of biological distributions also is determined by biological interactions.
4. Non-linearities in biological dynamics over different scales often confound interpretation of patterns. Thus, understanding and prediction of ecosystem function must derive from the study of fundamental processes in conjunction with the coupling of circulation and biological models.
5. The variability of physical forcing, particularly unpredictable fluctuations, may be more important to understanding biological activity than the mean conditions. Spectral analysis provides information on the scales of variability and is useful for comparing the effects of external forcing on different ecosystems.
Physical Indicators and their influence
From Daly and Smith, 2003
Influence of temperature
1. may constrain the maximum growth rate of phytoplankton
2. suggested that temperature, rather than food limitation, drive zooplankton production in temperate coastal regions
3. may be an important determinant of trophic structure
4. effect of temperature may be more important as a covariate with other factors than as a direct control of productivity.
...influence of temperature on marine productivity remains equivocal.
Hydrodynamic processe are believed to control primary productivity in the ocean by governing irradiance and nutrients. (see below, keep in mind that marine ecology is being discussed - and therefore processes are very different than at an estuarine systm)
... the scale at which vertical mixing is a function of wind velocity, duration of wind event, and fetch, and is generally confined to the upper 100m of the ocean.
Nutrient uptake and phytoplankton
Influence of temperature
1. may constrain the maximum growth rate of phytoplankton
2. suggested that temperature, rather than food limitation, drive zooplankton production in temperate coastal regions
3. may be an important determinant of trophic structure
4. effect of temperature may be more important as a covariate with other factors than as a direct control of productivity.
...influence of temperature on marine productivity remains equivocal.
Hydrodynamic processe are believed to control primary productivity in the ocean by governing irradiance and nutrients. (see below, keep in mind that marine ecology is being discussed - and therefore processes are very different than at an estuarine systm)

... the scale at which vertical mixing is a function of wind velocity, duration of wind event, and fetch, and is generally confined to the upper 100m of the ocean.
Nutrient uptake and phytoplankton
Primary Production
from Daly and Smith, 1993
Primary Production defined as a change in community biomass over time, is a function of new organic material formed and of losses due to respiration, sinking, grazing, diffusion, and advection during the specified time period. The global pattern of primary production resembles that of phytoplankton biomass.
Primary Production defined as a change in community biomass over time, is a function of new organic material formed and of losses due to respiration, sinking, grazing, diffusion, and advection during the specified time period. The global pattern of primary production resembles that of phytoplankton biomass.
Aquatic ecosystem
The inherent variability of fluid dynamics is recognised as a driving force in the variability of aquatic ecosystems, but a theory to explain the response of marine communities to physical influences is not well developed. The important physical proceses are those that control nutrient and irradience availability and the relative locations of prey and predators, but the extent to which those processes control plankton production is unknown.
...because marine ecosystems are multidimensional, it is difficult to seperate the variability induced by physical proceses from tha tof population dynamics.
Thursday, November 23, 2006
Monday, November 20, 2006
Objectives of data analysis
Why analyse data?
you try to answer the question - is there a hidden determinism in your data?
and after knowing that you would like to
a) predict or
b) extract a deterministic signal from noisy background
c) gain better insight and understanding of the underlying dynamics
paraphrased from Chaos and Time-series analysis by Sprott.
(a similar thing is mentioned in kingston - see.)
My ideas -
Step 1:
Is there a hidden determinism in the data?
Traditional statistical technique -
Autocorrelation?
Itertative NN technique -
Test existence of the relationship using alternating division in data and using a large test set.
Step 2:
Gain better understanding of underlying dynamics:
is there a periodicity?
is there relationships between parameters?
Traditional statistical technique -
Periodicity -
Fourier analysis
Lyuponov exponents?
Relationships between parameters –
descriptive statistics – scatter diagram
ANOVA / MANOVA/
Iterative NN technique -
Periodicity –
??
Relationship between parameters -
Non – linear principal component analysis?
Sensitivity analysis
weights method shows that parameters are highly dependent
derivatives method shows that chlorophyll is more sensitive to changes in certain parameters. (get exact statement)
Step 3:
Is there a predictive function/model/law?
Traditional statistical technique -
MA?
ARMA?
ARIMA?
Iterative NN technique -
Test existence of a predictive function using sequential division in data (and using a large test set?)
Before we get into any further tradition statistical technique selection – check assumptions.
a) what kind of variables – ordinal, continuous etc are required and
b) what kind of distribution is required – normal? whatever..
c) how many independent and dependent variables are accounted for.
Sunday, November 19, 2006
Watanabe's Theorem of the Ugly Duckling
This entire post is quotes from Kanal (1993)
Theorem of the Ugly Duckling
(by Watanabe)
If the resemblance or similarity between two objects is measured by the maximum number of predicates shared by them, then the similarity between any pair of arbitrary objects is the same. Thus a swan and a duck, and two swans are equally similar. This situation arises because all predicates are treated equally.
...performing logical manipulation on raw data resulting from observation does not provide grouping among observed objects because unless some predicates are considered more important than others, i.e., weighted more heavily, the above theorem holds.
What makes human cognition possible is the evaluative weighing whose origin is aesthetic and emotional in the broadest sense of the terms.
In Pattern Recognition - Human and Mechanical he summarizes earlier papers of his that cover a variety of philosophical views on categorisation, from Greeks and Western philosophers to Brahmanism and Buddhism.
many of the points about categorisation touched on in Wantabe's papers and books are addressed at length in an excellent book by George Lakoff called Women, Fire and Dangerous Things (see)
Quotes on Modeling Techniques from Kanal
interesting quotes from Kanal (1993)
1. Paul Werbos had talked about error back propagation in his doctoral thesis "Beyond regression: new tools for prediction and analysis in behavioral sciences" (1974) before Rumelhart et al (1986).
2.
3.
6. Theorem of the Ugly Duckling
(by Watanabe)
separate post.
1. Paul Werbos had talked about error back propagation in his doctoral thesis "Beyond regression: new tools for prediction and analysis in behavioral sciences" (1974) before Rumelhart et al (1986).
2.
A basic problem of statistical pattern recognition, viz., the dimensionality -sample size problem also arises in artificial neural systems. In the design of multilayer feedforward networks one question is how many hidden units to use.A few techniques are reviewed - but they appear an over-kill (in the best case) and clearly inapplicable (in the worst case) because in my experiments the size is not crucial - the order of free parameters in the network remains constant. there is only one hidden layer - and no. of hidden units are of order of 1 to 10.
3.
While the generation of artificial neural networks excite us, we should keep in mind that:4.
(1) As has been shown by [Comparing hierarchical statistical classifiers with error back propagation neural network; Kanal et al (1989)], often fairly simple statistical decision tree methods give equivalent or better results;
(2) the various neural network paradigms for pattern classification introduced in recent years have close connections with stochastic approximation, estimation and classification procedures known in statistical pattern recognition; and
(3) rather good algorithms have been developed in recent years for large combinatorial optimization problems whereas neural networks have so far only been demonstrated on much smaller problems. It remains to be shown that combinatorial optimization is a good area for artificial neural networks.
...the problem of scalability remains one of the basic concerns for employing various pattern recognition, parallel processing, and machine intelligence tools on real world problems.5. "They were AI as long as it was unclear how to make them work." After a very interesting discussion on what is AI, based on AI Magazine, Roger Shank (1991)
6. Theorem of the Ugly Duckling
(by Watanabe)
separate post.
On matching techniques and problems
In Kanal (1993), the following figure is shown to present the various techniques used for various aspects of pattern recognition. It is suggested that we may look at the sceanario as a "bag of tools for a bag of problems".
Another diagram in the paper which is of relevance (and is presented wrt a case study)

*it is difficult to see how can one argue against the other techniques if they have not even been applied (specially since all these papers argue that each technique and each problem need to be matched; there are no general solutions for all complex problems). however, i wonder what would be use the use of the above arguement if all techniques are applied to test its validity.

My point is we really need to see what is the limiting factor here - if data is the limiting factor then using fancier technique would not help - and therefore more than one technique is sufficient.*
If we do not observed an entire cycle of the process then we cannot expect the fancier techniques to help. The problem really does boil down to knowing if we are observing at the right temporal scale.
Another diagram in the paper which is of relevance (and is presented wrt a case study)

*it is difficult to see how can one argue against the other techniques if they have not even been applied (specially since all these papers argue that each technique and each problem need to be matched; there are no general solutions for all complex problems). however, i wonder what would be use the use of the above arguement if all techniques are applied to test its validity.
Pattern Recognition - review paper 1992
On pattern, categories and alternate realities
Laveen N Kanal
Pattern Recognition letters 14 (1993) 241 - 255
A review on pattern recognition presented at the 11th international conference of pattern recognition on reception of an award; the author is from dept of computer science.
The review having been presented in 1992 is, now, dated. The good thing is that certain questions are so fundamental that they cannot be dated. Some of such questions are presented in an informal language, which makes it very good. Tho there is some history also described - it is so intertwined with the personal history of the author that apart from giving an interesting perspective, it does little else. The quotes (also picked from general philosophy) are excellent and i have posted them separately.
Finally an excellent read for anyone interested in pattern recognition or one of the techniques used for them.
Wednesday, November 15, 2006
Ecology
Ecology is the study of patterns in nature, of how those patters came to be, how they change in space and time, why some are more fragile than others. Population ecology is concerned with how populations interact with the environment and how these interactions give rise to patterns of community and ecosystems.Sharon E Kingland
Page 1
Modeling Nature
Tuesday, November 14, 2006
Neural Network - Statistical perspective
Neural Networks: A Review from a statistical perspective
Bing Cheng and D.M. Titterington
Statistical Science
1994, Vol 9, No. 1, pgs 2-54
A excellent paper that introduces the connections between statistical methods and neural networks.
* Introduces NN jargon and, to some extent, statistical jargon to the reader. Good as a reference for and introduction to FFNN, i.e., multi layer perceptron.
* Mentions concerns with back propagation algorithm, namely, speed and debates relevance of various quasi-newton techniques - which by not evaluating second derivative speed up the training (relevant to me because that is what i am using).
* Gives good examples of successful NN - in one case of NN that did not need any training. other examples are way too complicated as opposed to generalised techniques.
* Section 4 'Multilayer Perceptron' is very relevant tho sometimes decends to gibberish considering that I am not so well acquinted with the statistical jargon. A few revisits would be able to improve that situation - which would be very much worth it.
* Section 5 discusses Hopfield network - for associative memories (i.e. cluster analysis) but this is too much of jargon and gibberish for me - at this point.
* Section 6 discusses 'Associative networks with unsupervised learning' in lesser detail; but I have not dwelled too much with this section either.
Section 7 talks about the 'Future' - raises some good questions.
* The paper also references to a few really good papers.
Note: use this paper while introducing terms like multi layer perceptron; training algorithm. you would find these terms being defined from the more conservative statistical background useful.
Discriminant Analysis
Discriminant Analysis: Pattern recognition
Cluster Analysis: Associative memories
Discriminant analysis is a technique for classifying a set of observations into predefined classes. The purpose is to determine the class of an observation based on a set of variables known as predictors or input variables. The model is built based on a set of observations for which the classes are known. This set of observations is sometimes referred to as the training set.Complete article here
Cluster Analysis: Associative memories
Isn't discriminant analysis the same as cluster analysis?Complete article here
No. In discriminant analysis the groups (clusters) are determined beforehand and the object is to determine the linear combination of independent variables which best discriminates among the groups. In cluster analysis the groups (clusters) are not predetermined and in fact the object is to determine the best way in which cases may be clustered into groups


Monday, November 13, 2006
What can I infer from 'Results of Statistical Tests'?
Statistical results done on data throws up many patterns much like the data itself. It is getting interesting as I try and figure out
- which of the results are showing a pattern because of the pattern inherent in the statistical test. In my case, especially in SA by partial derivation method
- which are being shown because of extreme values present in the data set. In my case, especially when the point keeps moving between training, validating and testing data sets.
(and the most brilliant one)
- how much of it getting stuffed up because I am using the wrong scale to look the environment.
Thursday, November 09, 2006
How this blog is organised
The point of this blog has been already explained in the Blog description. I will not cover that section again, I will instead, explain how this blog and labels are going to be organised.
Firstly, there is classification based on major research areas that i would be covering

* Understanding interactions within the population, i.e., if we only look at population vs time graph
* Understanding interactions of the population with its environment, i.e., if we look at chemical, physical and other population changes in the surroundings of population of our interest.
This section would cover discovering patterns in the time series, including periodicity and then moving to prediction. Hows "Patterns, Periodicity and Prediction in Phytoplankton Population Ecology" for a review article?
Secondly, there is classification based on the blog post made.
The definition section includes all quotes, excerpts and definitions. The rest of the diagram is self explanatory.
Final point in this post is about labels -
Labels: Each blog entry will therefore have labels based on the above categorisation. If it is a definition, the keyword would also be a label.
Friday, November 03, 2006
Scale
Determining natural Scales of Ecological Systems
RL Habeeb; J Treilco; S Wotherspoon and CR Johnson
(UTAS)
Ecological Monographs 75(4) 2005 pp 267-287
The paper does not seem to include much introductory material. The problem, as explained in the abstract, is very exciting. The rest of the paper, more or less, gives a feeling as being a part of a continuing discussion. Might revisit later - not thrilled. note also - the paper is sent from utas.
Characteristic length scale (CLS): The characteristic length is a natural scale of a system at which the underlying deterministic dynamics are most clearly observed.
A key issue in ecology is to identify the appropriate scale(s) at which to observe trends in ecosystem behaviour.
Subscribe to:
Posts (Atom)
