A weir is a small overflow type dam commonly used to raise the level of a small river or stream. Weirs have traditionally been used to create mill ponds. Water flows over the top of a weir, although some weirs have sluice gates which release water at a level below the top of the weir. The crest of an overflow spillway on a large dam is often called a weir.
en.wikipedia.org/wiki/Weir
Showing posts with label Definition/ Quote. Show all posts
Showing posts with label Definition/ Quote. Show all posts
Wednesday, April 11, 2007
Tuesday, April 10, 2007
River Reach
A reach in geography is an expanse, or widening, of a stream or river channel. This commonly occurs after the river or stream is dammed. A reach is similar to an arm.
'Reach' definition in wikipedia
An arm in geography, is a narrow extension, inlet, or smaller reach, of water from a much larger body of water, like an ocean, sea, or lake. Although different geographically, a sound or bay may be called an arm.
'Arm' definition in wikipedia
'Reach' definition in wikipedia
An arm in geography, is a narrow extension, inlet, or smaller reach, of water from a much larger body of water, like an ocean, sea, or lake. Although different geographically, a sound or bay may be called an arm.
'Arm' definition in wikipedia
Anabranch
a secondary channel of a river that leaves the main channel and rejoins it further downstream.
Australia provides a continental setting conducive to the formation of anabranching rivers. Very low relief, within channel vegetation and cohesive fine-grained sediment in an arid environment with declining flow discharges and increasing sedimentation downstream encourage the development of anabranches.
www.artistwd.com/joyzine/australia/strine/a-5.php
from "define: anabranch" on google
Friday, March 09, 2007
What is the difference between correlation and linear regression?
FAQ# 1143
Correlation and linear regression are not the same.
Correlation quantifies the degree to which two variables are related. With correlation, you are not drawing a best-fit line (that is regression). You simply are computing a correlation coefficient (r) that tells you how much one variable tends to change when the other one does. When r is 0.0, there is no relationship. When r is positive, there is a trend that one variable goes up as the other one goes up. When r is negative, there is a trend that one variable goes up as the other one goes down.
With correlation, you don't have to think about cause and effect. It doesn't matter which of the two variables you call "X" and which you call "Y". You'll get the same correlation coefficient if you swap the two.
Correlation is almost always used when you measure both variables. It rarely is appropriate when one variable is something you experimentally manipulate.
Linear regression finds the best line that predicts Y from X. The X variable is usually something you experimentally manipulate (time, concentration...) and the Y variable is something you measure. The decision of which variable you call "X" and which you call "Y" matters, as you'll get a different best-fit line if you swap the two. The line that best predicts Y from X is not the same as the line that predicts X from Y (however both those lines have the same value for R2).
Sunday, February 25, 2007
Misspecified Model
Could not find the definition of 'misspecified model' directly. However, there are 2 links talking about it -
oh and from
@inbook { White2006 ,chapter = "Approximate nonlinear forecasting methods",title = "Handbook of Economic Forecasting",volume = "1",author = "Halbert White",publisher = "Elsevier B.V."year = 2006}
the statistical model he used to reach his conclusions is "misspecified." This means, in part, that he did not adequately account for other factors which have an impact on crime rates - and which provide an alternate explanations for his findings. When a statistical model is misspecified, it cannot be used as the basis from which to draw conclusions about the impact of policy decisions. One clue that a model is misspecified is if it produces implausible findings.now if you see that this is being said in a debate against fire arms, you'll take the implausable findings with a pinch (no more) of salt.
Even a misspecified model can be highly accurate in its predictions. Its problems will show up in other ways (e.g. non-random error, which I am guessing is probably the case here; they are probably more likely to be wrong for some cases than for others, e.g. self-funders).ah that too is from a debate! the other side - lovely!!
(In point of fact -- most media types tend to make predictions based upon isspecified models. And the biggest problem is not misspecification, but that they do not realize that they are actually using models in the first place. This is one of the many problems that occur when English majors do political science.)
oh and from
@inbook { White2006 ,chapter = "Approximate nonlinear forecasting methods",title = "Handbook of Economic Forecasting",volume = "1",author = "Halbert White",publisher = "Elsevier B.V."year = 2006}
When one's goal is to make predictions, the use of a misspecified model is by no means fatal. Our predictions will not be as good as tehy would be if \mu
(true function) were accessable.
Wednesday, February 14, 2007
Regression Coefficient
An asymmetric measure of association; a statistic computed as part of a regression analysis.www.ojp.usdoj.gov/BJA/evaluation/glossary/glossary_r.htm
when the regression line is linear (y = ax + b) the regression coefficient is the constant (a) that represents the rate of change of one variable (y) as a function of changes in the other (x); it is the slope of the regression linewordnet.princeton.edu/perl/webwn
Time-Series Analysis. You can use regression analysis to analyze trends that appear to be related to time.general knowledge isnt it?
Reliability in statistical techniques
J Scott Armstron, Fred Collopy,Reliability addresses the question of whether repeated application of a procedure will produce similar results.
Error measures for generalising about forecasting methods: Emperical comparisons;
Pg 69-80; International Journal of Forecasting; Vol 8; Year 1992
From before:
Stability is consistency of results, during validation phase, with different samples of data
(Monica Adya and Fred Collopy, J Forecast. 17 481-495 (1998) )
To look at stability in SA, we will define stability as
the consistency of (SA) results within candidate (networks) solutions;
this can be easily justified for SA results in FFNN because we already know that there is high redundancy in free parameters in FFNNs. Therefore, the SA technique that shows consistency between all the networks - and also shows corresponding change in consistency when the data quality is seen to change... promises to be a better technique???
Sunday, January 28, 2007
Data Smoothing and Data Filtering
From Numberwatch UK
or from an imaging processing website
What I am doing is using heuristic technique
i am only filtering out very low frequency, very high numerical values to eliminate bias due to large numerical values in the set.
Data smoothing is a form of low pass filtering, which means that it blocks out the high frequency components (short wiggles) in order to emphasis the low frequency ones (longer trends).
There are two popular forms; (a) the running mean (or moving average) and (b) the exponentially weighted average. They are both implemented by means of efficient recursive formulae:
or from an imaging processing website
Smoothing is a process by which data points are averaged with their neighbours in a series, such as a time series, or image. This (usually) has the effect of blurring the sharp edges in the smoothed data. Smoothing is sometimes referred to as filtering, because smoothing has the effect of suppressing high frequency signal and enhancing low frequency signal. There are many different methods of smoothing...blah blah - need to rewrite.
What I am doing is using heuristic technique
i am only filtering out very low frequency, very high numerical values to eliminate bias due to large numerical values in the set.
Friday, January 26, 2007
Curse of Dimensionality
Curse of Dimensionality :
The exponential growth in the complexity of the problem that results from an increase in the number of dimensions (for example, the dimension of input vector).
From the wikipedia:
The exponential growth in the complexity of the problem that results from an increase in the number of dimensions (for example, the dimension of input vector).
From the wikipedia:
The curse of dimensionality is a term coined by Richard Bellman to describe the problem caused by the exponential increase in volume associated with adding extra dimensions to a (mathematical) space.
The curse of dimensionality is a significant obstacle in machine learning problems that involve learning from few data samples in a high-dimensional feature space.
Sunday, January 21, 2007
Cross Validation and Split- Sample Method
According to the Neural Net Usenet -
FAQs : What are cross-validation and bootstrapping?
Cross Validation
Split Sample or Hold Out
The rest of the document is interesting - it defines and discusses Jackknifing and Bootstrapping.
MATLAB neural network manual does not use either terms (as far as I can see, and I was mistaken earlier in thinking that it is called cross validation in MATLAB) - it uses the term "early stopping" for improving generalisation.
(pg 5-55, Neural Network Toolbox User's guide Version 4)
pps: there is more to the term 'cross validation', and the ambiguous way it is being used in the literature. I have seen more than one paper using the term in place of early stopping (etc). will investigate on that later if necessary - else will stick to the definition as above.
FAQs : What are cross-validation and bootstrapping?
Cross Validation
In k-fold cross-validation, you divide the data into k subsets of
(approximately) equal size. You train the net k times, each time leaving out one of the subsets from training, but using only the omitted subset to compute whatever error criterion interests you.
If k equals the sample size, this is called "leave-one-out" cross-validation. "Leave-v-out" is a more elaborate and expensive version of cross-validation that involves
leaving out all possible subsets of v cases.
Split Sample or Hold Out
cross-validation is quite different from the "split-sample" or "hold-out" method that is commonly used for early stopping in NNs. In the split-sample method, only a single subset (the validation set) is used to estimate the generalization error, instead of k different subsets; i.e., there is no "crossing".
While various people have suggested that cross-validation be applied to early stopping, the proper way of doing so is not obvious.
The rest of the document is interesting - it defines and discusses Jackknifing and Bootstrapping.
MATLAB neural network manual does not use either terms (as far as I can see, and I was mistaken earlier in thinking that it is called cross validation in MATLAB) - it uses the term "early stopping" for improving generalisation.
(pg 5-55, Neural Network Toolbox User's guide Version 4)
pps: there is more to the term 'cross validation', and the ambiguous way it is being used in the literature. I have seen more than one paper using the term in place of early stopping (etc). will investigate on that later if necessary - else will stick to the definition as above.
Thursday, January 18, 2007
Sensitivity Analysis - the confusion between definitions
Sensitivity Analysis (SA) is the study of how the variation in the output of a model (numerical or otherwise) can be apportioned, quantitatively or qualitatively to different sources of variation\cite{AppliedEuropeanCommission2006}.
SA has also been defined mathematically as differentiation of output with respect to input \cite{Saltelli2006}. This confusion is apparent in the reviews of SA techniques for neural networks \cite{Olden2004}, \cite{Gevrey2003}. While Olden \cite{Olden2004} refer to the algorithms using various names, including one called SA; Gevrey \cite{Gevrey2003} uses SA as a generic term encompassing all the techniques used to compare contribution of variables in the neural network model. We will use SA as a generic term encompassing all the various techniques following the definition above given by \cite{AppliedEuropeanCommission2006}.
Monday, December 11, 2006
Predictions and Forecasts
Typically, the terms are used as synonyms - and it is important to remember that.
Principles of Forecasting, which is linked to by Journal of Forecasting, defines
However since there are predictions and then there are predictions and then there are ofcourse forecasts - many people use these terms as 'jargon' with subtle differences; usually these are not obvious. Google gives some results which i will put when i update.
The defintion that is of significance to me was found on the NASA website where it talks in context of fluid dynamics here
The rest of the definitions at the NASA site are quite relevant too.
Principles of Forecasting, which is linked to by Journal of Forecasting, defines
Forecasting
Estimating in unknown situations. Predicting is a more general term and connotes estimating for any time series, cross-sectional, or longitudinal data. Forecasting is commonly used when discussing time series.
Prediction
A statement regarding future events or events that are unknown to the forecaster. Generally used as synonymous with forecast. Often, but not always used when the task involves forecasting with cross-sectional data (e.g., personnel predictions).
Forecast
A prediction or estimate of an actual value in a future time period (for time series) or for another situation (for cross-sectional data). Forecast, prediction, and prognosis are typically used interchangeably.
However since there are predictions and then there are predictions and then there are ofcourse forecasts - many people use these terms as 'jargon' with subtle differences; usually these are not obvious. Google gives some results which i will put when i update.
The defintion that is of significance to me was found on the NASA website where it talks in context of fluid dynamics here
Prediction.
Prediction is defined asUse of a CFD model to foretell the state of a physical system under conditions for which the CFD model has not been validated. (AIAA G-077-1998)Prediction is going beyond the validation database and performing simulations of untested systems.
The rest of the definitions at the NASA site are quite relevant too.
Monday, November 27, 2006
statistics basics 2
having visited covariance and correlation here; let us continue with some more basic definitions. i am picking these up using google 'define: ' facility. unless it is something earth breakingly original, i would not cite reference.
Multivariate Analysis of Variance
And from manova page here
Analysis of Variance: Statistical test of significance developed by Sir Ronald fisher. It is also called the F-Ratio or ANOVA for ANalysis Of Variance. The test is designed to establish whether or not a significant (nonchance/nonrandom) difference exists among several sample means. Statistically, it is the ratio of the variance occurring between the sample means to the variance occurring within the sample groups.and from Wikipedia
A large F-Ratio, that is when the variance between is larger than the variance within, usually indicates a nonchance/nonrandom significant difference -- that is a difference created by the introduction of the independent variable.
Analysis of variance (ANOVA) is a collection of statistical models and their associated procedures which compare means by splitting the overall observed variance into different parts.
The initial techniques of the analysis of variance were pioneered by the statistician and geneticist R. A. Fisher in the 1920s and 1930s, and is sometimes known as Fisher's ANOVA or Fisher's analysis of variance, due to the use of Fisher's F-distribution as part of the test of statistical significance.
One-way ANOVA is used to test for differences among three or more independent groups.
Multivariate analysis of variance (MANOVA) is used when there is more than one dependent variable.
Multivariate Analysis of Variance
Multivariate analysis of variance (MANOVA) is an extension of analysis of variance (ANOVA) methods to cover cases where there is more than one dependent variable and where the dependent variables cannot simply be combined.
As well as
* identifying whether changes in the independent variables have a significant effect on the dependent variables,
* the technique also seeks to identify the interactions among the independent variables and the association between dependent variables, if any.
And from manova page here
The main objective in using MANOVA is to determine if the response variables, are altered by the observer’s manipulation of the independent variables. Therefore, there are several types of research questions that may be answered by using MANOVA:
1) What are the main effects of the independent variables?
2) What are the interactions among the independent variables?
3) What is the importance of the dependent variables?
4) What is the strength of association between dependent variables?
5) What are the effects of covariates? How may they be utilized?
Assumptions
Normal Distribution: - The dependent variable should be normally distributed within groups. Overall, the F test is robust to non-normality, if the non-normality is caused by skewness rather than by outliers. Tests for outliers should be run before performing a MANOVA, and outliers should be transformed or removed.
Linearity: - MANOVA assumes that there are linear relationships among all pairs of dependent variables, all pairs of covariates, and all dependent variable-covariate pairs in each cell. Therefore, when the relationship deviates from linearity, the power of the analysis will be compromised.
Homogeneity of Variances: - Homogeneity of variances assumes that the dependent variables exhibit equal levels of variance across the range of predictor variables. Remember that the error variance is computed (SS error) by adding up the sums of squares within each group. If the variances in the two groups are different from each other, then adding the two together is not appropriate, and will not yield an estimate of the common within-group variance. Homoscedasticity can be examined graphically or by means of a number of statistical tests.
Homogeneity of Variances and Covariances: - In multivariate designs, with multiple dependent measures, the homogeneity of variances assumption described earlier also applies. However, since there are multiple dependent variables, it is also required that their intercorrelations (covariances) are homogeneous across the cells of the design. There are various specific tests of this assumption.

Basic Statistics - defintions
The covariance of two variables is the average of first variable minus its means times second variable minus its mean
 this measures how the variables vary together.
Correlation between two variables is the covariance of the two variables divided by product of standard deviations of the two variables. This standardizes the correlation to lie between -1 to +1
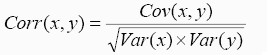 Correlation measures the strength of the linear relationship between two variables.
pg. 46
Bayesian statistics
William m. blostad
wiley
 this measures how the variables vary together.
 Correlation between two variables is the covariance of the two variables divided by product of standard deviations of the two variables. This standardizes the correlation to lie between -1 to +1
 Correlation measures the strength of the linear relationship between two variables.
 pg. 46
Bayesian statistics
William m. blostad
wiley
Friday, November 24, 2006
Scales of Interaction
Quotes from Daly and Smith, 1993
1.
1.

2. The scale of a varying property is defined as the distance (or time) over which its quantity remains the same before significantly changing. The physical processes most likely to influence biological activity in the ocean are those that occur in the space/time domain intrinsic to specific organisms.
For example, the doubling time of phytoplankton ranges from about 0.5 to 10 days, in which time an individual cell may be transported several kilometers by currents. Thus, small- to meso-scale physical processes are relevant to the study of phytoplankton.
3. This review indicates that biological processes may be more important at smaller scales where behavior such as vertical migration and predation may control the location and production of plankton. Physical processes may be more important at larger scales in structuring biological communities and determining particle flow, but the magnitude of biological distributions also is determined by biological interactions.
4. Non-linearities in biological dynamics over different scales often confound interpretation of patterns. Thus, understanding and prediction of ecosystem function must derive from the study of fundamental processes in conjunction with the coupling of circulation and biological models.
5. The variability of physical forcing, particularly unpredictable fluctuations, may be more important to understanding biological activity than the mean conditions. Spectral analysis provides information on the scales of variability and is useful for comparing the effects of external forcing on different ecosystems.
Physical Indicators and their influence
From Daly and Smith, 2003
Influence of temperature
1. may constrain the maximum growth rate of phytoplankton
2. suggested that temperature, rather than food limitation, drive zooplankton production in temperate coastal regions
3. may be an important determinant of trophic structure
4. effect of temperature may be more important as a covariate with other factors than as a direct control of productivity.
...influence of temperature on marine productivity remains equivocal.
Hydrodynamic processe are believed to control primary productivity in the ocean by governing irradiance and nutrients. (see below, keep in mind that marine ecology is being discussed - and therefore processes are very different than at an estuarine systm)
... the scale at which vertical mixing is a function of wind velocity, duration of wind event, and fetch, and is generally confined to the upper 100m of the ocean.
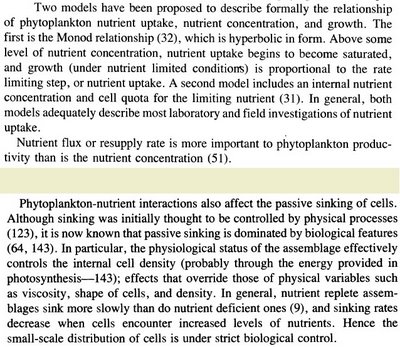
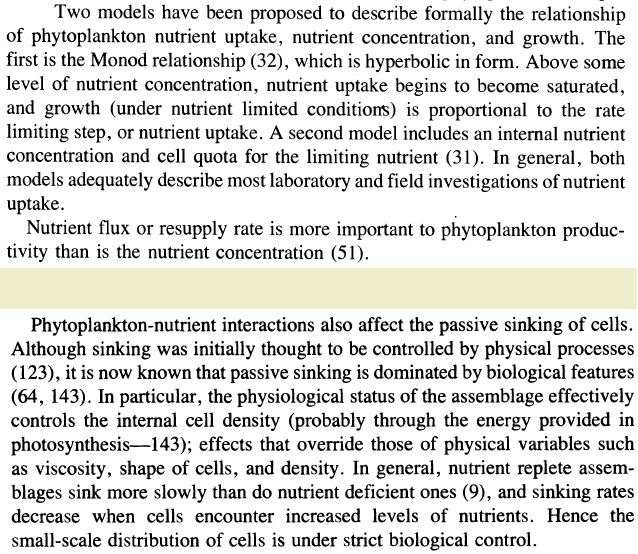
Nutrient uptake and phytoplankton
Influence of temperature
1. may constrain the maximum growth rate of phytoplankton
2. suggested that temperature, rather than food limitation, drive zooplankton production in temperate coastal regions
3. may be an important determinant of trophic structure
4. effect of temperature may be more important as a covariate with other factors than as a direct control of productivity.
...influence of temperature on marine productivity remains equivocal.
Hydrodynamic processe are believed to control primary productivity in the ocean by governing irradiance and nutrients. (see below, keep in mind that marine ecology is being discussed - and therefore processes are very different than at an estuarine systm)

... the scale at which vertical mixing is a function of wind velocity, duration of wind event, and fetch, and is generally confined to the upper 100m of the ocean.
Nutrient uptake and phytoplankton
Primary Production
from Daly and Smith, 1993
Primary Production defined as a change in community biomass over time, is a function of new organic material formed and of losses due to respiration, sinking, grazing, diffusion, and advection during the specified time period. The global pattern of primary production resembles that of phytoplankton biomass.
Primary Production defined as a change in community biomass over time, is a function of new organic material formed and of losses due to respiration, sinking, grazing, diffusion, and advection during the specified time period. The global pattern of primary production resembles that of phytoplankton biomass.
Aquatic ecosystem
The inherent variability of fluid dynamics is recognised as a driving force in the variability of aquatic ecosystems, but a theory to explain the response of marine communities to physical influences is not well developed. The important physical proceses are those that control nutrient and irradience availability and the relative locations of prey and predators, but the extent to which those processes control plankton production is unknown.
...because marine ecosystems are multidimensional, it is difficult to seperate the variability induced by physical proceses from tha tof population dynamics.
Monday, November 20, 2006
Objectives of data analysis
Why analyse data?
you try to answer the question - is there a hidden determinism in your data?
and after knowing that you would like to
a) predict or
b) extract a deterministic signal from noisy background
c) gain better insight and understanding of the underlying dynamics
paraphrased from Chaos and Time-series analysis by Sprott.
(a similar thing is mentioned in kingston - see.)
My ideas -
Step 1:
Is there a hidden determinism in the data?
Traditional statistical technique -
Autocorrelation?
Itertative NN technique -
Test existence of the relationship using alternating division in data and using a large test set.
Step 2:
Gain better understanding of underlying dynamics:
is there a periodicity?
is there relationships between parameters?
Traditional statistical technique -
Periodicity -
Fourier analysis
Lyuponov exponents?
Relationships between parameters –
descriptive statistics – scatter diagram
ANOVA / MANOVA/
Iterative NN technique -
Periodicity –
??
Relationship between parameters -
Non – linear principal component analysis?
Sensitivity analysis
weights method shows that parameters are highly dependent
derivatives method shows that chlorophyll is more sensitive to changes in certain parameters. (get exact statement)
Step 3:
Is there a predictive function/model/law?
Traditional statistical technique -
MA?
ARMA?
ARIMA?
Iterative NN technique -
Test existence of a predictive function using sequential division in data (and using a large test set?)
Before we get into any further tradition statistical technique selection – check assumptions.
a) what kind of variables – ordinal, continuous etc are required and
b) what kind of distribution is required – normal? whatever..
c) how many independent and dependent variables are accounted for.
Subscribe to:
Posts (Atom)
